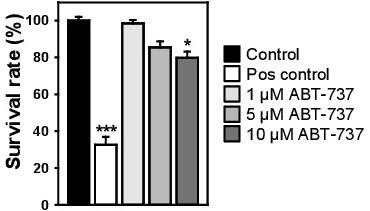
Fig. 12. HepG2 cells were treated with various concentrations of ABT-737 for 24 h, and the cell viability was subsequently quantified using the WST-1 assay. Readings were done in quadruplicates, data are present as mean ± SEM, n=3 (three independent experiments). Positive control - 20 % ethanol for 60 min. One-way ANOVA with Newman-Keuls multiple comparison test was used; *P< 0.05, ***P< 0.001.